Are you trying to make your WordPress site’s debug mode active?
When dealing with WordPress themes, plugins, or custom coding, you could run across several issues. These problems are simple to solve using WordPress debug mode.
WordPress Debug Mode is a PHP constant (a permanent global variable) that can be used to trigger the “debug” mode throughout WordPress. When debug mode is enabled all PHP code related notices, warnings, errors and other debugging information are recorded in a file named ./wp-content/debug.log. This file is used to display information on PHP errors and notices to help discover what may be the cause of an error on your website. WordPress provides a debug tool to help debug WordPress, which can be enabled in the wp-config.php file.
This post will demonstrate how to quickly enable WordPress debug mode in order to correct website faults.
Why Turn on WordPress Debugging Mode?
Conflicts on your website can occasionally be brought on by a WordPress plugin, theme, or custom code like PHP or JavaScript. This may result in various issues, and you might see that your website isn’t operating as it should.
Now, you may always disable and remove a number of plugins to determine which one is generating the error. To determine the error’s primary source, you can also change your WordPress theme or get rid of any custom codes.
All of this, though, takes a long time. You’ll need to eliminate each plugin separately, modify several themes, and alter custom scripts.
By turning on WordPress debug mode, website faults can be fixed more quickly. It displays a list of all the issues and alerts with your website. By doing so, you may rapidly identify and address problems with your WordPress website. Even errors that might not otherwise be apparent are found by it.
After that, let’s examine how to activate WordPress’ debug mode. We’ll demonstrate 2 approaches. You can examine the debug mode manually or with a WordPress plugin.
Method 1: Use a plugin to enable WordPress Debug Mode
Method 2: Activate WordPress Debug Mode manually
Method 1: Use a plugin to enable WordPress Debug Mode
Using the WP Debugging plugin is a simple approach to activate debug mode. Beginners and people who aren’t at ease working with website files are advised to use this strategy.
A free WordPress plugin called WP Debugging is functional right out of the box. You won’t need to manually edit your website’s files if you use this plugin.
Installing and activating the WP Debugging plugin is the first step.
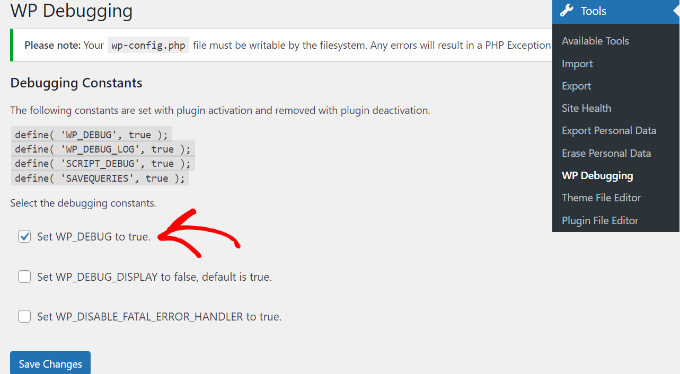
Once activated, you can access WP Debugging under Tools in your WordPress dashboard. Make sure the option to “Set WP DEBUG to true” is turned on next.
Following that, you’ll see that a ‘Debug Quick Look’ option has been added to your admin bar at the top.
Go ahead and choose the “View File” option after hovering your cursor over it.
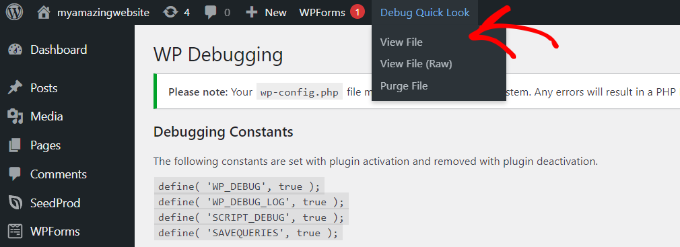
This will reveal the log file containing all of your website’s errors. Then you can easily identify what’s creating problems on your website and resolve them.
Remind yourself to disable the plugin after you’ve finished debugging your website.
Method 2: Activate WordPress Debug Mode manually
Editing the wp-config.php files is the second way to make WordPress debug mode available. This approach is more sophisticated and appropriate for individuals who feel confident changing website files.
Before making any changes to the files on your website, we advise making a backup. In the case that something goes wrong, you can easily restore your website in this method.
You’ll need a file transfer protocol (FTP) software for Mac or Windows to access the website’s file.
Simply head to the public html folder after logging in. The file “wp-config.php” is located here.
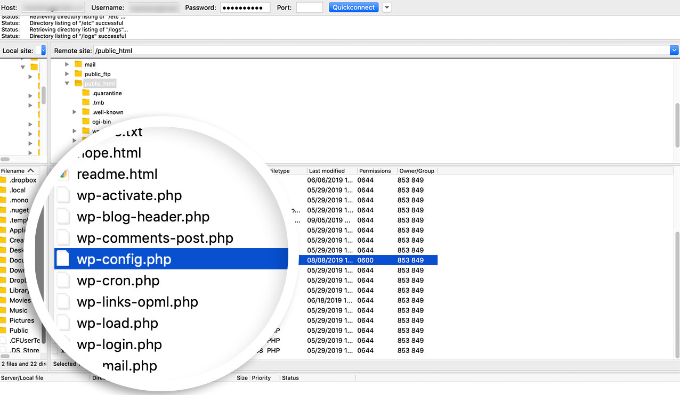
As an alternative, plenty of WordPress hosting services offer permit you to control your website’s files through the cPanel.
For instance, in Bluehost, you can navigate to the “Advanced” tab and then select File Manager.
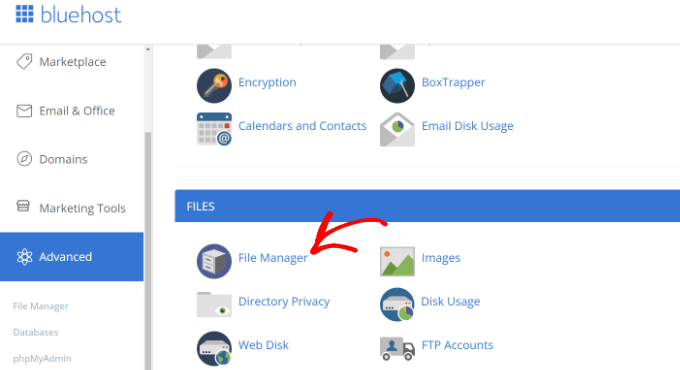
Simply use the panel on your left to access the public html folder from this point.
Click on the “wp-config.php” file and scroll down.
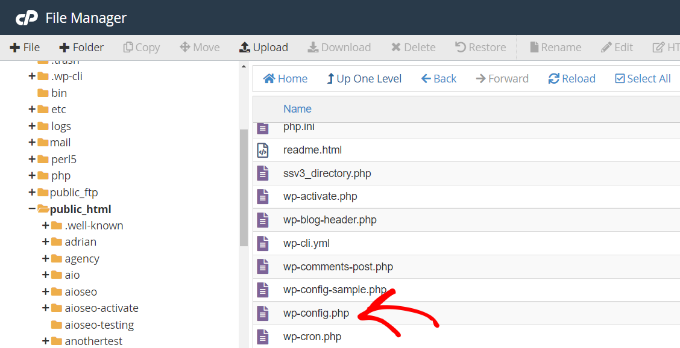
Right-clicking the file will allow you to download it to your computer. Making a backup copy of the file is a good idea in case something goes wrong.
Use any programme or tool, such as Notepad or Sublime Text, to open the file after that.
Upon opening the document, scroll down to the “That’s all, quit editing” section. The following code should be put before the “Happy publishing” line:
| 1 2 | define( 'WP_DEBUG', true);define( 'WP_DEBUG_LOG', true); |
Before closing the file, don’t forget to save it.
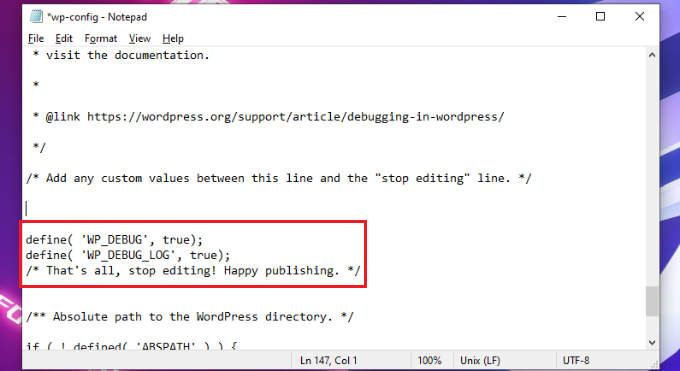
The wp-config.php file needs to be uploaded back to your website server using the FTP client next.
To access your website’s error logs, visit to the public html/wp-content/debug.log directory in your website files. Simply download the file and open it in notepad to see any problems with your website.
You can turn off the debug mode once you’ve finished testing your website.
Then, either delete the code you added to the wp-config.php file or modify the following code to have a false value to accomplish that. To do that, repeat these steps:
| 1 | define( 'WP_DEBUG', false); |
We hope this article helped you how to quickly activate WordPress debug mode to fix website faults.
